Pre-Screening Motor Imagery BCI Literacy
Using Low-Sample EEG-Derived Features
In order to determine the practicality of assessing a person's motor imagery brain-computer interface (MI-BCI) compatibility through only low-sample EEG-derived features, we developed pre-screening models to estimate an individual's MI-BCI literacy from compact EEG summaries, enabling prospective users to gauge whether extended calibration and training are likely to be worthwhile. Rather than requiring full-length MI calibration, our approach uses a brief resting-state baseline and only the first n=15 imagery trials from left-vs-right hand motor imagery runs, extracted from a small sensorimotor electrode set. We compute interpretable features capturing sensorimotor rhythm strength and separability (mu/beta band power, ERD/ERS summaries, CSP-derived class separability, SNR/variability) along with a small set of resting predictors (e.g., resting rhythm measures and spectral summaries). Ground-truth literacy is defined as each subject's cross-validated CSP-LDA decoding accuracy on the PhysioNet EEG Motor Movement/Imagery Dataset.
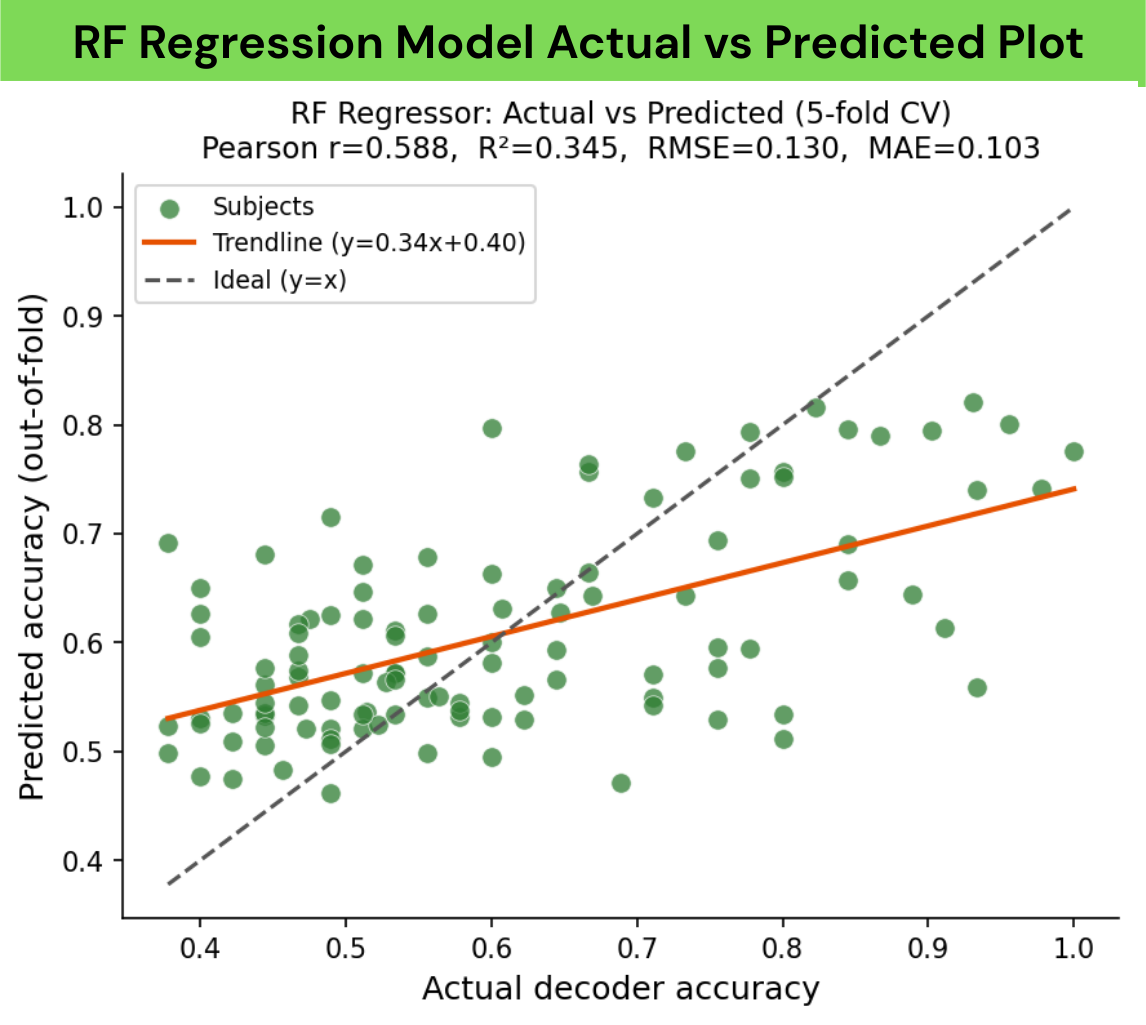
Using 5-fold cross-validation, the best-performing regression model (Random Forest) achieves a moderate association with decoder-derived literacy (Pearson's r=0.580; R²=0.302 on subjects with complete labels). For an additional operational screening view, we trained a Random Forest binary classifier to separate high vs. low performers at an accuracy threshold of 0.65, achieving a LOOCV accuracy of 0.788 with stronger performance on the majority low-performing class (precision 0.833, recall 0.890) but low sensitivity to high performers (precision 0.619, recall 0.500). Overall, while low-sample EEG features may not support precise individualized performance estimation, they can reliably support coarse screening decisions, motivating rapid, data-efficient pre-screening in future MI-BCI pipelines.
01 Introduction
1.1 Context
Brain–computer interfaces (BCIs) enable direct communication between neural activity and external devices by translating brain signals into actionable commands. With recent breakthroughs in neurotechnology, electroencephalography (EEG)-based BCIs have emerged as one of the most practical and widely studied approaches due to their safety, relatively low cost, and portability. In particular, motor imagery–based BCIs (MI-BCIs), which decode voluntary modulation of sensorimotor rhythms during imagined movements, have demonstrated substantial potential in assistive technologies such as neuroprosthetic control, communication systems for individuals with paralysis, and motor rehabilitation following neurological injury.[5]
Despite these advances, a persistent limitation of MI-BCIs is the substantial inter-subject variability in performance. While most people require training to reliably use BCIs in general, a significant fraction of users, estimated to be around 20%, fail to achieve reliable control even after training, a phenomenon commonly referred to as BCI illiteracy.[6] As a result, current BCI deployment typically requires lengthy and resource-intensive EEG recording sessions, calibration procedures, and user training phases before determining whether a given individual is compatible with a specific BCI paradigm. This trial-and-error process is costly for researchers and clinicians (up to hundreds or even thousands of dollars) and can be discouraging or emotionally taxing for prospective users.
1.2 Prior Research
Although prior research has identified EEG-derived correlates of MI-BCI performance, such as resting-state alpha power,[11] sensorimotor rhythm (SMR) strength,[3] oscillatory stability, and measures of neural complexity,[8][9] there is currently no widely adopted method for preliminary assessment of MI-BCI compatibility. Most existing approaches either focus on a single predictor, require extensive task-based data, or evaluate performance only after full BCI calibration.
One existing model does exclusively use resting-state features but requires more extensive data collection and equipment (e.g., additional non-EEG measurements).[13] Consequently, there remains a gap between theoretical predictors of BCI literacy and a practical, low-burden screening tool that can be applied early in the BCI pipeline. In this work, we target a low-sample screening setting by combining brief resting recordings with only the first 15 motor imagery trials, while keeping features interpretable and easy to compute.
1.3 Goals, Relevant Data and Features
We created BCI literacy predictors (one binary, one regression) designed to estimate an individual's compatibility with MI-based BCIs using a small set of interpretable EEG-derived features. Rather than replacing a full BCI decoder, our goal was to test the feasibility using solely lightweight, data-efficient pre-screening models that can be applied early in the pipeline.
Scope
This study is limited to offline, retrospective analysis of the PhysioNet EEG Motor Movement/Imagery Dataset (109 subjects). We did not test on live streaming EEG, novel subject populations, cross-session or cross-dataset generalization, or non-MI BCI paradigms. The pipeline was designed for binary left-vs-right hand imagery only. Results should be interpreted as a proof-of-concept on a single public benchmark rather than a validated clinical screening tool.
Our framework supports two operational views of "literacy". The first is a continuous prediction of expected MI decoder accuracy (regression), and the second is a binary screening decision that separates likely high vs. low performers at a predefined accuracy threshold (classification). To remain low-sample, features are derived from short resting baselines and only the first n=15 imagery trials from left-vs-right motor imagery runs. The full feature set integrates complementary information capturing baseline rhythm structure (resting spectral summaries), early-trial class separability (CSP-derived separability, mu/beta bandpower), task modulation (ERD/ERS), and signal quality/consistency (SNR and trial-to-trial variability). By synthesizing these features into a single predictive model and validating it against decoder-derived MI performance, we aim to understand if it's possible to reduce the time and data required to assess MI-BCI suitability while maintaining interpretability and transparency.
02 Methods
2.1 Data Acquisition and Preprocessing
EEG data were obtained from the PhysioNet EEG Motor Movement/Imagery Dataset,[1] comprising recordings from 109 healthy subjects performing motor execution and motor imagery tasks. Each subject completed runs of four paradigms: (1) left/right fist execution, (2) left/right fist imagery, (3) fists/feet execution, and (4) fists/feet imagery. Signals were recorded with BCI2000[2] at 160 Hz from 64 electrodes in the international 10-10 layout.
Although 64 channels are available, our analyses focus on a pre-defined sensorimotor region of interest (ROI) centered on C3, Cz, and C4, with adjacent channels FC1/FC2 and CP1/CP2 to capture nearby premotor/somatosensory activity and the spatial spread of mu/beta rhythms.
Preprocessing was performed in MNE-Python.[4] We applied common-average reference and FIR bandpass filtering (1–40 Hz). For task-based analyses, epochs were extracted from −1 to +4 s relative to cue onset, and epochs exceeding ±100 μV were rejected; subjects required at least 5 valid epochs per condition. Resting-state features used baseline runs R01 (eyes open) and R02 (eyes closed). ICA artifact removal (Picard; 20 components) was used to reduce ocular artifacts using Fp1 and AF7/AF8 as EOG proxies. To improve spatial specificity, Laplacian filtering was applied for ROI channels by subtracting the mean of the four nearest neighbors; Laplacian filtering was not applied to LZC features.
Unless otherwise stated, resting features use R01/R02, while early-trial MI features use only the first n=15 trials from the left-vs-right motor imagery runs (runs 4/8/12) and are computed primarily on C3/Cz/C4.
2.2 Features
2.2.1 Resting Alpha Power and Asymmetry
Alpha band (8–13 Hz) activity has been shown to significantly impact a subject's compatibility with an MI-BCI. The power of the alpha band during resting states over the motor cortex region (channels C3, C4, and Cz) reveals potential sensitivity and stability that will be more apparent in any MI trials or calibration. The eyes-closed baseline was used specifically because alpha waves are strongest during this state. After applying preprocessing, the power spectral density (PSD) was calculated with Welch's method using a window size of 2048 samples (~12.8 seconds at 160 Hz) with 50% overlap. Alpha asymmetry, reflecting the level of hemispheric balance during resting activity, was computed from the C3 and C4 electrodes.
Resting alpha power relative to total power (RPL) was also extracted, following findings that resting alpha power alone is not sufficient to indicate strong BCI compatibility, and that other frequency bands (particularly the theta band, 4–8 Hz) must also be considered.
2.2.2 Resting Beta Power
The beta band (13–30 Hz) is responsible for rebound during motor imagery. This feature was extracted identically to resting alpha power, with two key differences: the frequency mask was changed to the beta range, and the beta band was split into upper beta (20–30 Hz) and lower beta (13–20 Hz), where PSD was individually computed. This split accounts for the different roles: lower beta is associated with sensorimotor ERD/ERS patterns (the backbone of motor imagery),[14][15] while upper beta captures the broader state of the motor cortex.[7]
2.2.3 Baseline Sensorimotor (SMR) Strength, IAF, and Aperiodic Exponent
Sensorimotor rhythms (SMR) are oscillations that occur at the alpha/mu (8–13 Hz) and beta (13–30 Hz) frequency bands during movement and motor imagery. We use SMR readings from baseline EEG trials to indicate the relationship between SMR strength and MI-BCI compatibility. Following established methods, motor cortex channels C3 and C4 with Laplacian filtering were selected, and PSD values were converted to decibels (dB). The baseline SMR strength is the measure of power relative to a modeled noise curve, represented by an exponential decay function and a Gaussian curve with two peaks for the mu and beta bands. The total PSD curve is:
where \(\varphi(f;\mu,\sigma)\) denotes the PDF of a normal distribution. The center frequency of the alpha peak (\(\mu_1\)) is the Individual Alpha Frequency (IAF), which can be indicative of MI performance. The peak amplitudes \(k_3\) and \(k_4\) indicate signal magnitude, and \(\lambda\) (the aperiodic exponent) represents cortical excitation-inhibition balance.
2.2.4 Alpha Power Variability
Alpha power variability is computed over two-second windows (one-second overlaps) from the Laplacian-filtered C3 and C4 channels using the eyes-open baseline, measured as the standard deviation or coefficient of variation of these power measurements. Subjects with higher variability may be able to perform MI that can be better translated by a MI-BCI, as greater shifts indicate a greater capability of ERD for MI.
2.2.5 Interhemispheric Coherence
Interhemispheric coherence captures the synchrony of the left and right hemispheres over the motor
cortex. Scipy's signal.coherence method was utilized with a Hamming window (2048 samples)
between signals from C3 and C4, positioned on opposite hemispheres. Mean coherence was computed within
the mu (8–13 Hz), total beta (13–30 Hz), upper beta (20–30 Hz), and lower beta (13–20 Hz) bands. When
hemispheres are highly synchronized, a MI-BCI may struggle to identify lateral indicators.
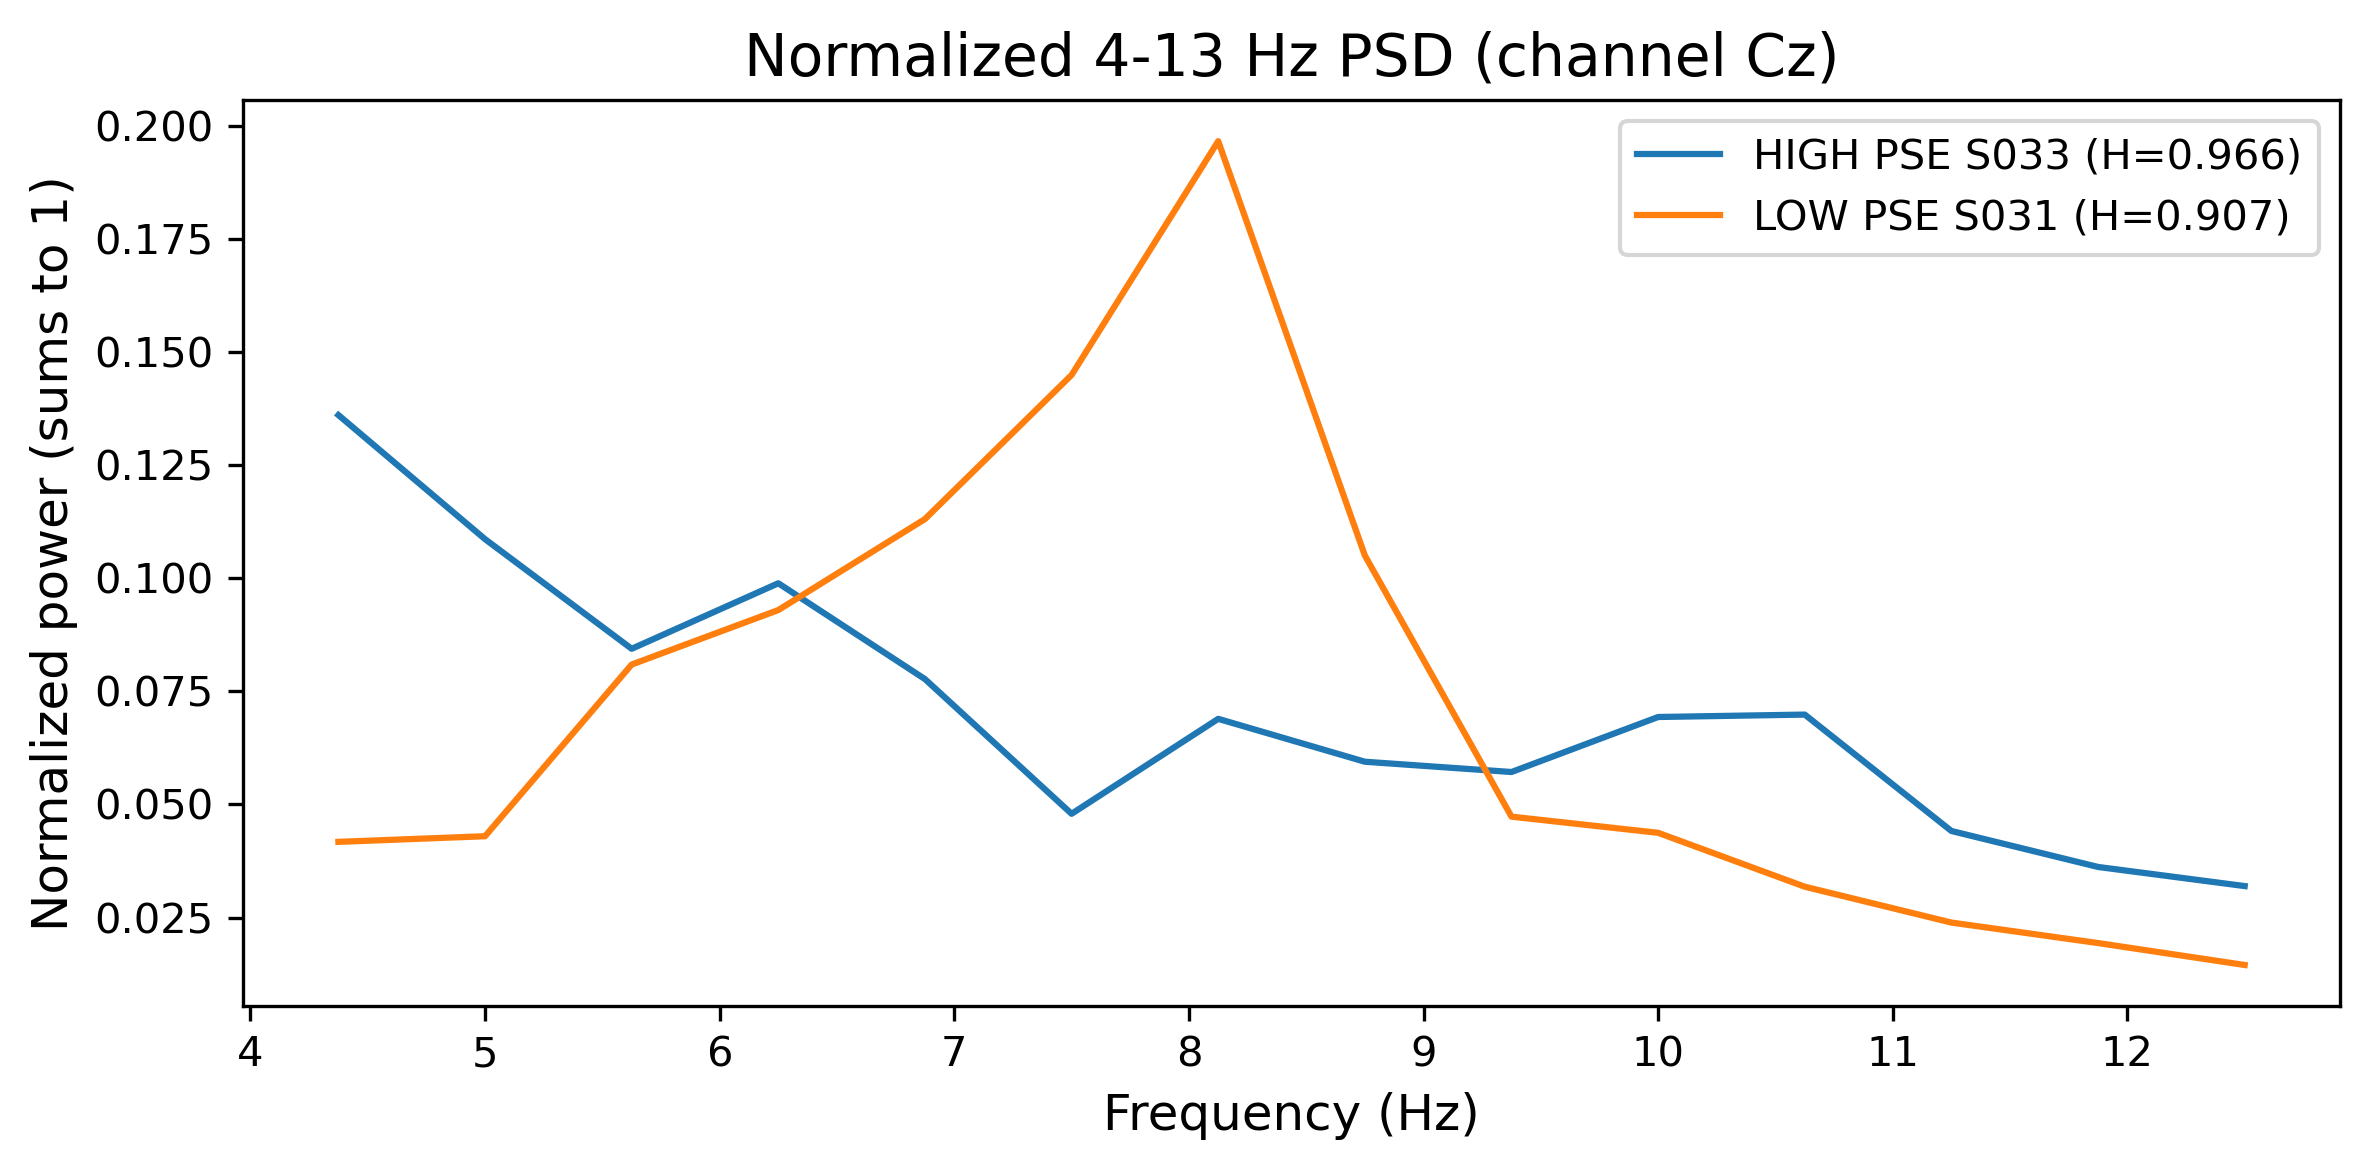
2.2.6 Power Spectral Entropy (PSE)
Power spectral entropy (PSE) quantifies signal complexity in the frequency domain by applying Shannon entropy to the PSD. PSD was computed using Welch's method with 50% overlapping windows, then normalized to form a probability distribution. Spectral entropy \(H\) was calculated as:
where \(p_i\) represents the normalized power at frequency bin \(i\) and \(N\) is the total number of frequency bins, yielding values between 0 (purely periodic signal) and 1 (white noise).[8] PSE was computed separately for alpha (8–13 Hz) and beta (13–30 Hz) bands. The primary feature was \(\Delta H = H_{\text{baseline}} - H_{\text{task}}\), representing entropy modulation during task performance.
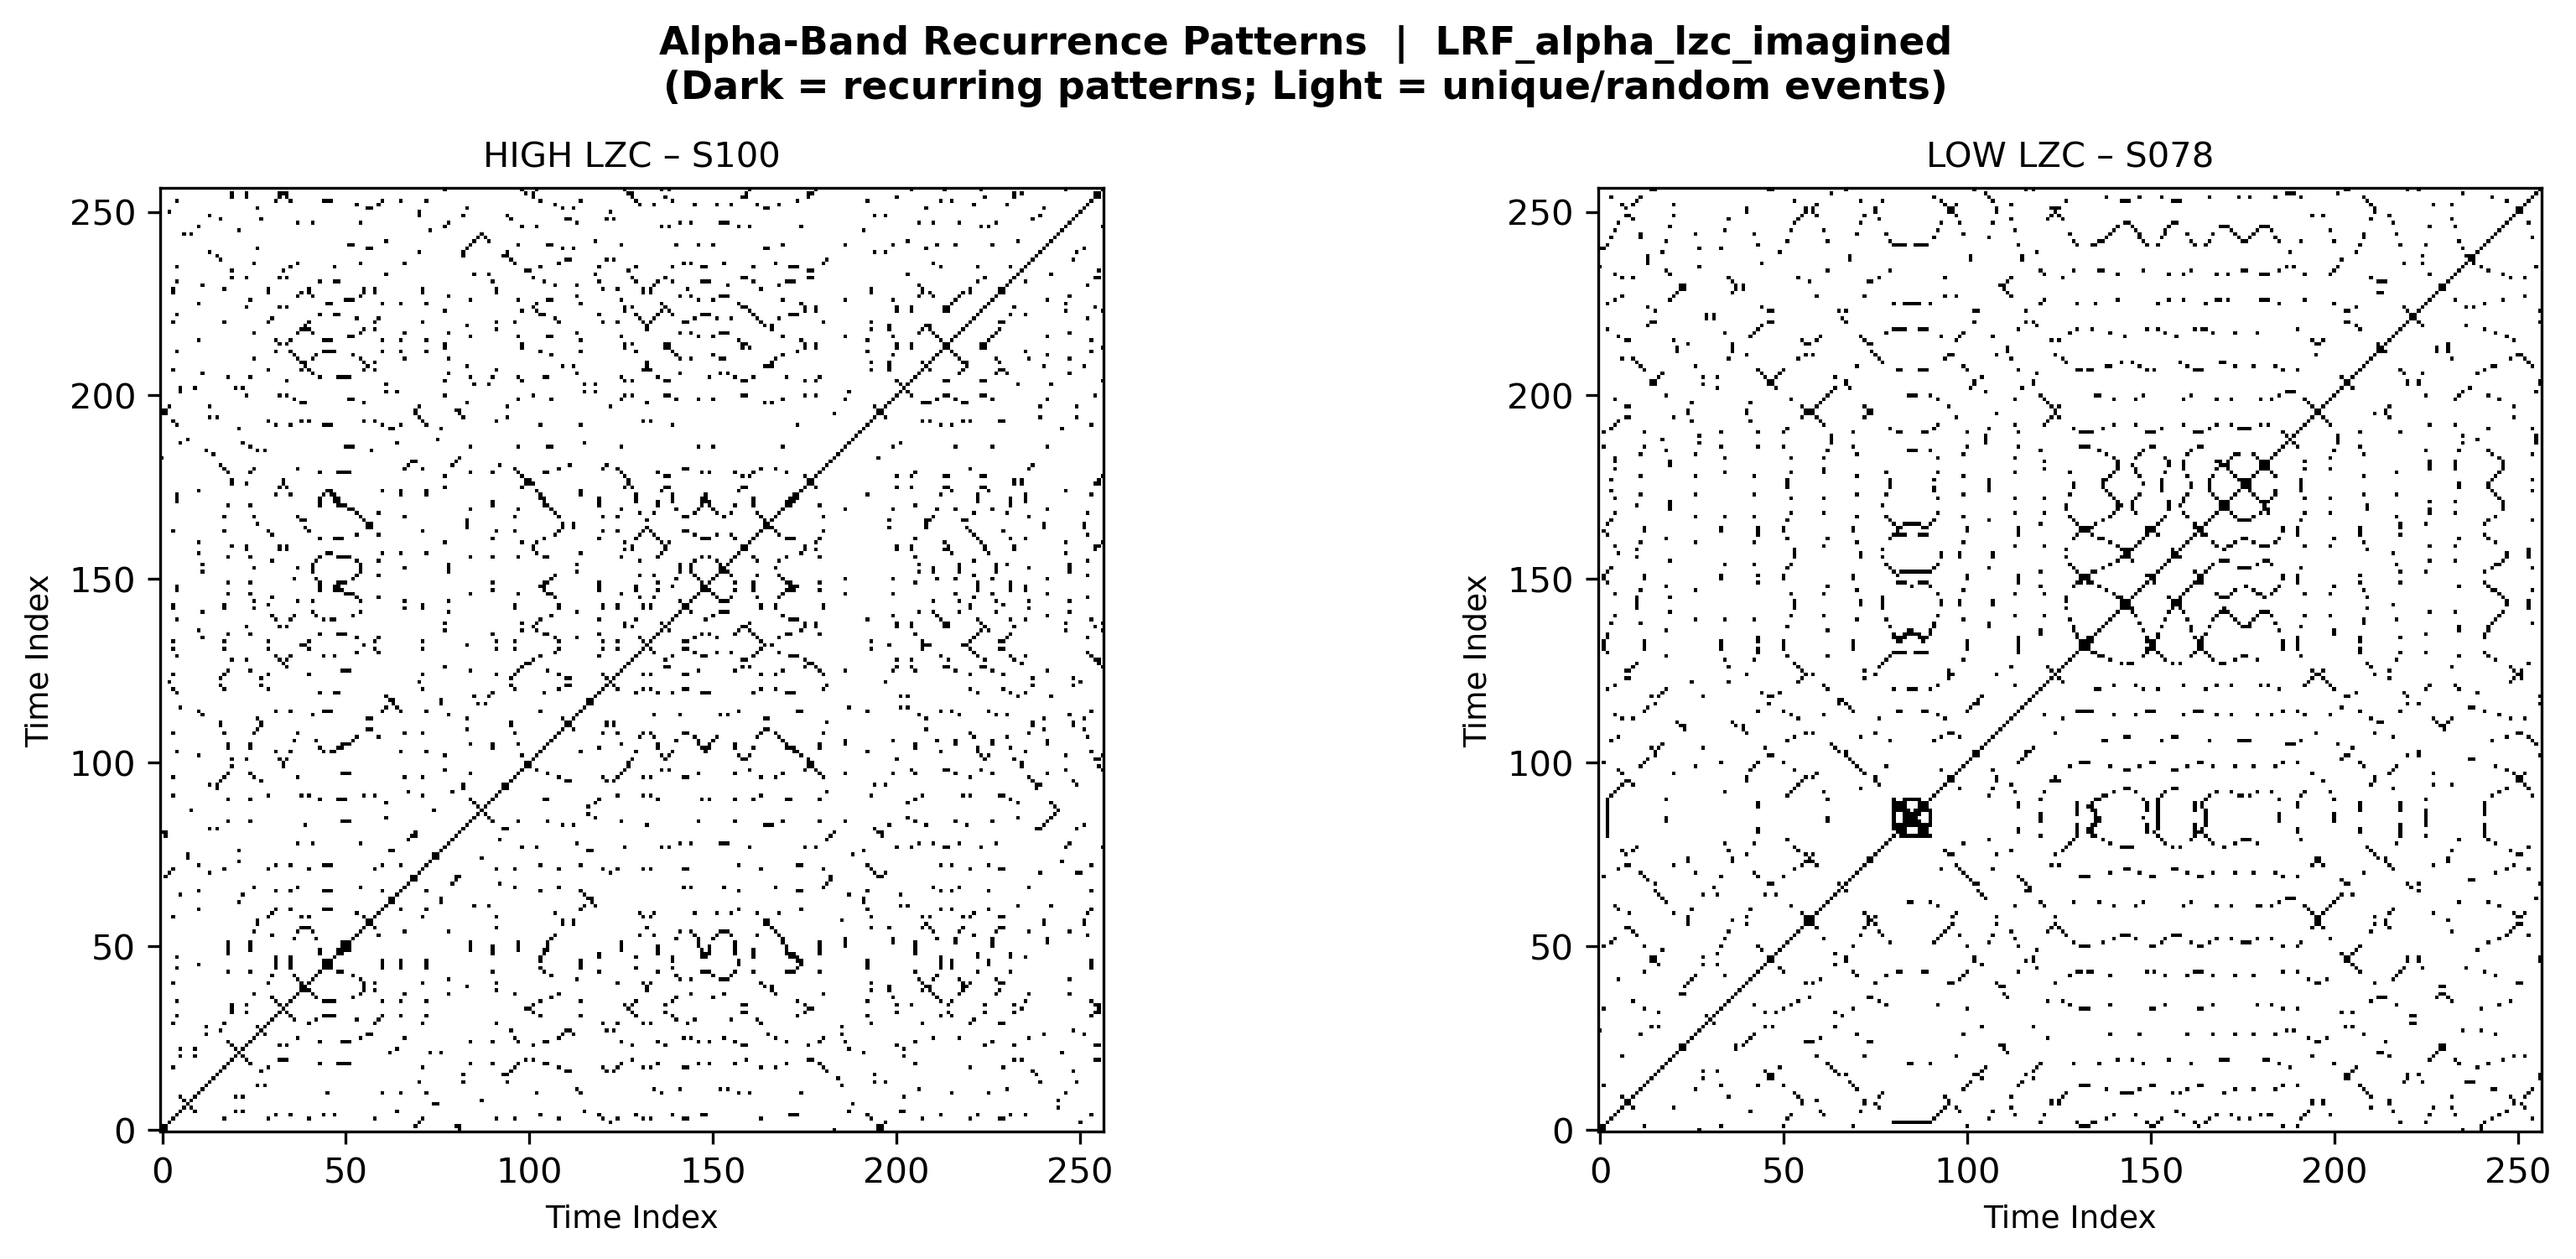
2.2.7 Lempel-Ziv Complexity (LZC)
Lempel-Ziv complexity (LZC) measures temporal pattern diversity by counting distinct subsequences as a signal unfolds.[9] Raw EEG signals were bandpass filtered to alpha or beta bands, then binarized using median thresholding (above median = 1, below = 0). The LZ76 algorithm was applied, normalizing by sequence length:
where \(n\) is the sequence length and \(c\) is the number of distinct substrings. High LZC indicates unpredictable, random-like signals (poor BCI compatibility); low LZC reflects repetitive, stereotyped activity (favorable for BCI decoding). The LZC gap metric—\(\Delta\text{LZC}_{\text{real}} - \Delta\text{LZC}_{\text{imagined}}\)—quantifies the difference in complexity modulation between actual movement and motor imagery; smaller gaps indicate that imagery closely mimics execution, a hallmark of strong BCI literacy.
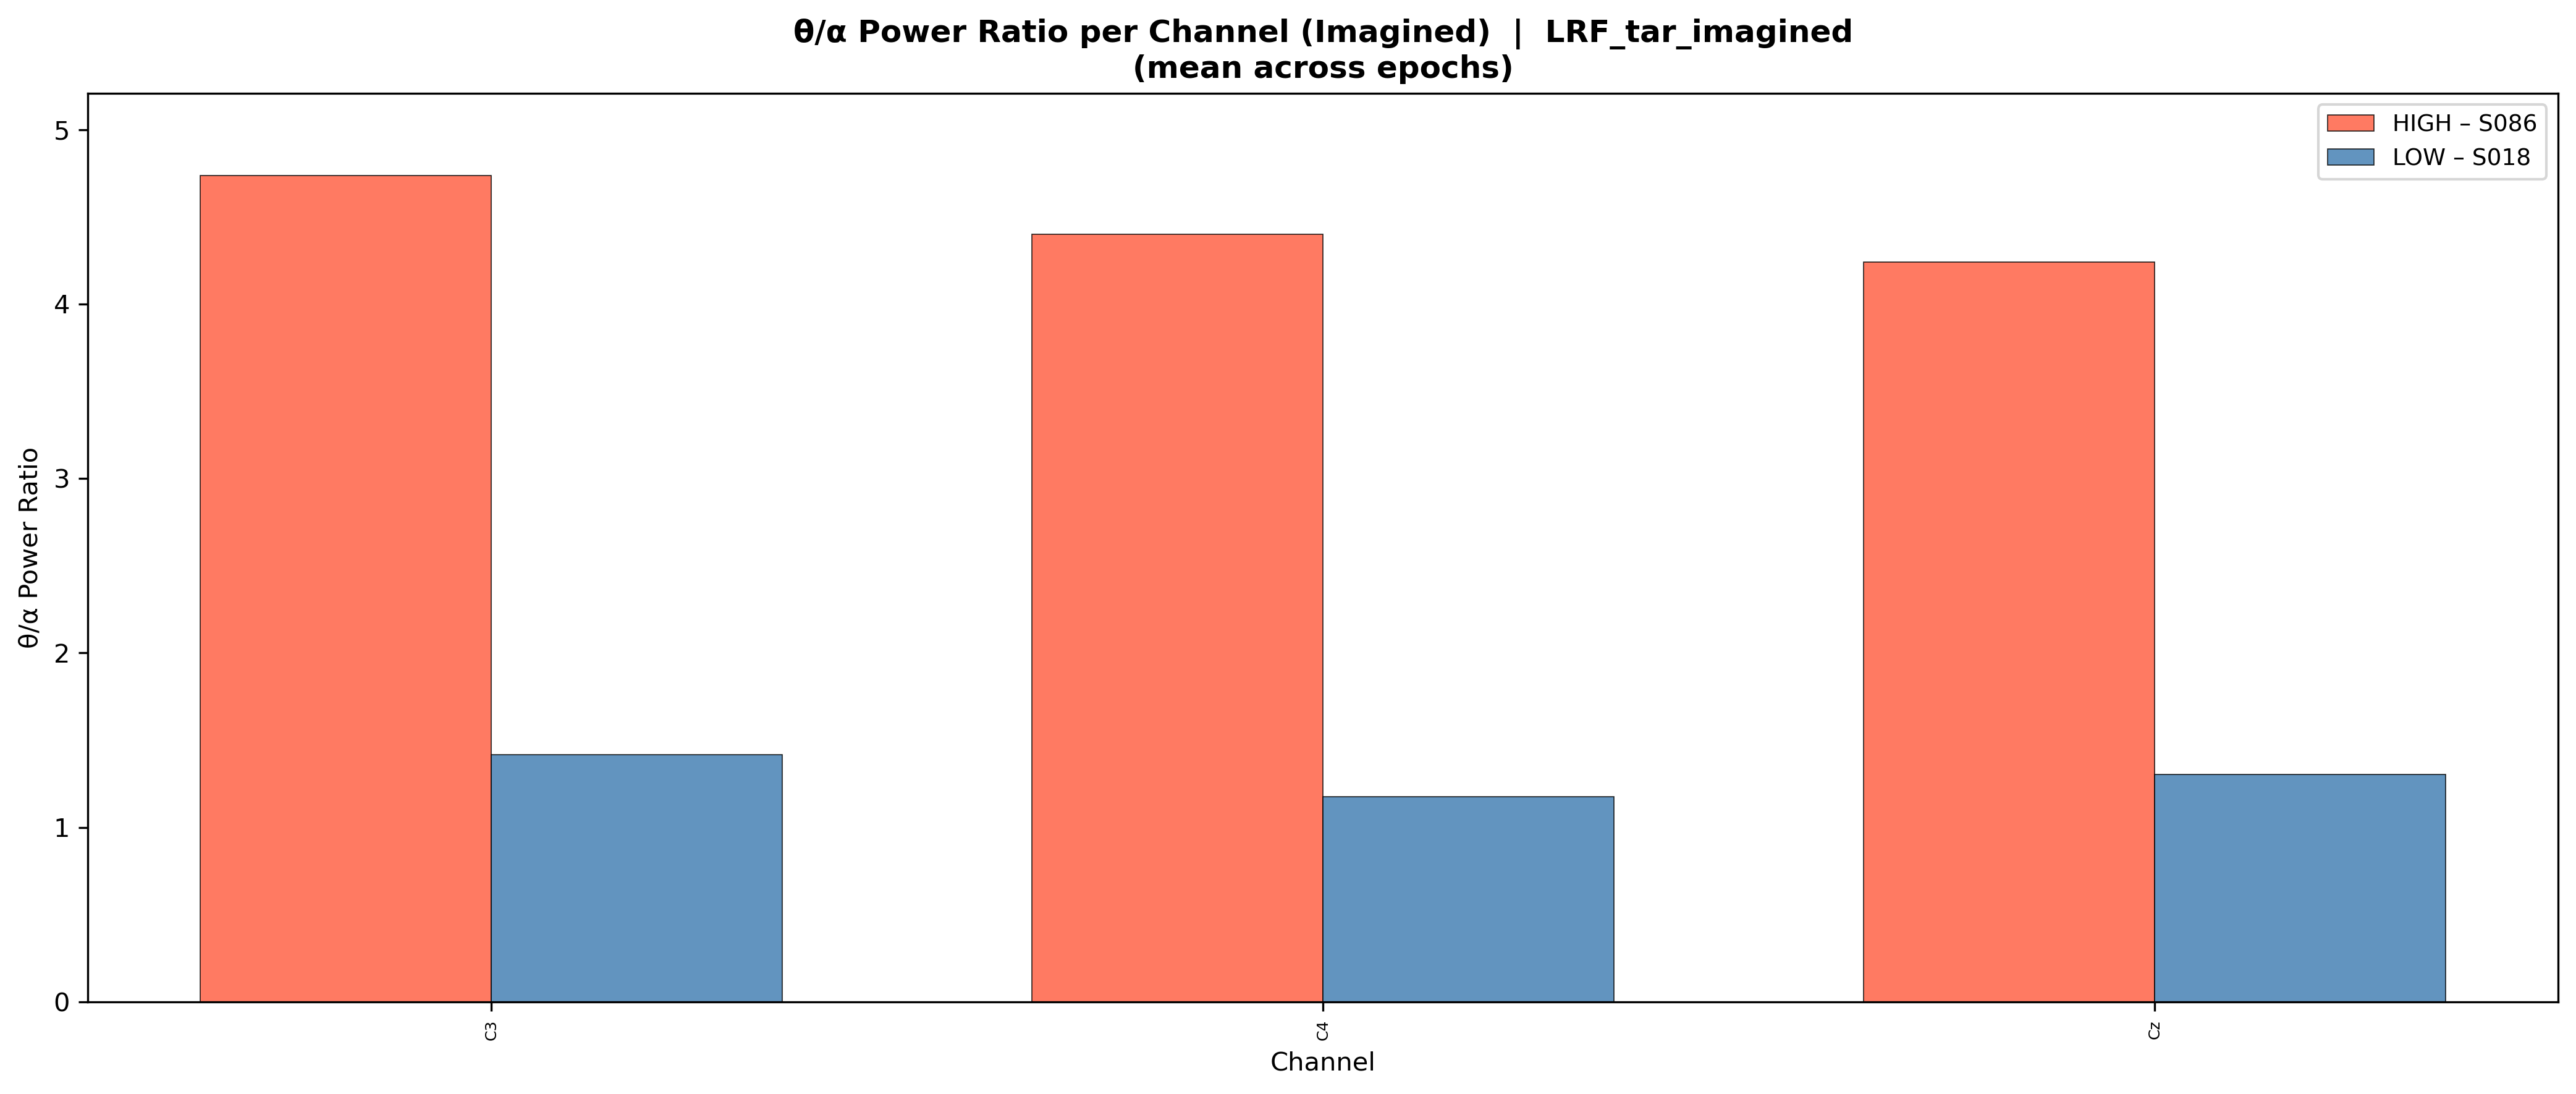
2.2.8 Theta/Alpha Power Ratio (TAR)
The theta/alpha power ratio (TAR) reflects attentional and cognitive control states relevant to BCI performance.[10][11] Theta (4–8 Hz) power is associated with attentional engagement and cognitive load, drowsiness, and mind-wandering, while alpha (8–13 Hz) power indexes cortical idling and inhibition. TAR was computed as the ratio of mean theta band power to mean alpha band power. Higher TAR values suggest elevated cognitive load or reduced cortical readiness, potentially hindering motor imagery performance [10]. We computed \(\Delta\text{TAR} = \text{TAR}_{\text{task}} - \text{TAR}_{\text{baseline}}\) to capture task-related modulation.
2.3 Dataset Construction and Statistical Analysis
All extracted features were aggregated to one vector per subject and merged by subject ID into a single design matrix. The merged feature set combines early-trial MI decodability features computed from only the first n=15 imagery trials, additional engineered rhythm-strength/ERD summaries from our EDA, and a small subset of resting-state predictors computed from R01/R02. This produces a fixed-length feature vector per subject (38 total merged features).
To reduce redundancy and control false discoveries, we performed supervised feature selection using rank-based association (Spearman), permutation-based significance testing, and Benjamini–Hochberg FDR correction. The final regression model was trained on the selected feature subset (12 predictors). When a subject was missing a feature group, we used feature-wise median imputation to preserve cohort size.
2.4 Ground-Truth MI Decoder (CSP-LDA)
To establish ground-truth MI performance, we implemented a subject-specific CSP-LDA decoder following the MetaBCI framework. EEG was filtered to the mu band (8–13 Hz) and cropped to a post-cue window (0.5–4.0 s). For each subject, we fit CSP and retained the top k=4 and bottom k=4 spatial filters (8 components total); log-variance features from CSP-projected signals were classified using LDA with shrinkage regularization. Decoder accuracy was evaluated with stratified 5-fold cross-validation within subject to produce a robust subject-level "BCI literacy" score used as the downstream prediction target.
2.5 BCI Literacy Screening Models
We trained supervised models to predict the decoder-derived literacy score from the merged feature vectors. Features were standardized prior to model fitting. We compared four regression models (Random Forest, Gradient Boosting, RBF-SVR, and Ridge regression) using 5-fold cross-validation, selecting the best model by mean R² while also reporting RMSE/MAE and correlation with ground-truth accuracy.
For an operational screening decision, we additionally trained a Random Forest binary classifier that labels subjects as high-performing if decoder accuracy ≥ 0.65 and low-performing otherwise, as previous studies determined that to be around the threshold between BCI-literate and BCI-illiterate people. This classifier was evaluated using leave-one-out cross-validation (LOOCV), and we report accuracy and class-wise precision/recall/F1.
03 Visualizations
To illustrate how our extracted features manifest in EEG recordings, we generated comparative visualizations contrasting subjects with extreme (highest vs. lowest) feature values. These visualizations reveal the neurophysiological signatures distinguishing BCI-literate from BCI-illiterate individuals, providing interpretations of otherwise abstract metrics.
Model Performance Comparison (Regression)
| Model | RMSE | MAE | R² | Pearson r | Spearman ρ |
|---|---|---|---|---|---|
| Random Forest | 0.125 ± 0.020 | 0.099 ± 0.015 | 0.302 ± 0.097 | 0.580 | 0.474 |
| Gradient Boosting | 0.134 ± 0.019 | 0.107 ± 0.017 | 0.169 ± 0.201 | 0.524 | 0.428 |
| SVM | 0.131 ± 0.028 | 0.105 ± 0.021 | 0.246 ± 0.112 | 0.492 | 0.413 |
| Ridge Regression | 0.128 ± 0.025 | 0.101 ± 0.017 | 0.269 ± 0.131 | 0.530 | 0.428 |
Random Forest performed best overall, achieving the lowest error (RMSE/MAE) and the highest R², Pearson correlation, and Spearman correlation, and was therefore selected as our primary regression model. We assumed Random Forest would also be the optimal model for binary classification.
Spearman Feature Selection Results (FDR α = 0.05)
| Feature | ρ | praw | pFDR |
|---|---|---|---|
| band_power_beta_C3 | −0.264 | 0.008 | 0.036 |
| band_power_beta_C4 | −0.258 | 0.011 | 0.038 |
| csp_class_separability | 0.454 | 0.000 | 0.002 |
| erdrs_mu_C3 | −0.365 | 0.000 | 0.002 |
| erdrs_mu_Cz | −0.257 | 0.011 | 0.038 |
| snr_mean | −0.247 | 0.013 | 0.041 |
| rpl | 0.314 | 0.001 | 0.008 |
| smr_strength | 0.399 | 0.000 | 0.002 |
| mu_erd_imagined_C3 | −0.251 | 0.011 | 0.038 |
| resting_rpl_alpha | 0.293 | 0.004 | 0.023 |
| resting_tar | −0.239 | 0.016 | 0.046 |
| resting_pse_avg | −0.284 | 0.006 | 0.030 |
The strongest predictors include CSP class separability, SMR strength, rhythm-length/power summaries (RPL/beta power), ERD/ERS measures in the mu band, and a small set of resting predictors (resting TAR, resting PSE, resting RPLα), supporting the interpretation that both early-trial separability and baseline rhythm structure inform BCI literacy screening.
RF Classifier Performance (LOOCV)
| Class | n | Precision | Recall | F1 |
|---|---|---|---|---|
| LOW | 73 | 0.833 | 0.890 | 0.861 |
| HIGH | 26 | 0.619 | 0.500 | 0.553 |
LOOCV Accuracy: 78.8% · Confusion Matrix: [[65, 8], [13, 13]] (rows = actual LOW/HIGH; columns = predicted LOW/HIGH)
04 Results
We constructed a merged subject-level feature representation combining early-trial MI decodability features computed from the first n=15 imagery trials (runs 4/8/12; channels C3/Cz/C4; 7–30 Hz), selected EDA-derived rhythm features (e.g., SMR/RPL/ERD summaries), and statistically validated resting-state predictors (resting RPLα, resting TAR, resting PSE). The merged dataset contains 38 features for all 109 subjects.
We trained and compared four regressors (Random Forest, Gradient Boosting, RBF-SVR, Ridge) using 5-fold cross-validation on subjects with both features and ground-truth decoder labels (N=99). Random Forest performed best overall (RMSE 0.125±0.020, MAE 0.099±0.015, R²=0.302±0.097, Pearson's r=0.580, Spearman ρ=0.474) and was selected as our primary regression model.
Using Spearman correlation with permutation-based p-values (5000 permutations) and Benjamini–Hochberg FDR correction (α=0.05), we retained 12 predictors for training. The largest Random Forest importances were assigned to CSP class separability and SMR strength, followed by resting spectral summaries (resting PSE, resting TAR), RPL, ERD/ERS (mu band), and beta power features, supporting the physiological interpretation that both early-trial separability and baseline rhythm structure contribute to literacy prediction.
For a practical screening decision, we trained a Random Forest classifier using an accuracy threshold of 0.65 to define high vs. low performers. Under LOOCV, the classifier achieved accuracy 0.788 with confusion matrix [[65, 8], [13, 13]] (rows = true LOW/HIGH; columns = predicted LOW/HIGH). Performance was stronger for the majority LOW class (precision 0.833, recall 0.890) than for the HIGH class (precision 0.619, recall 0.500), indicating the model is more reliable at identifying likely low performers than confidently detecting high performers.
Base-rate context: The dataset is imbalanced — 73 of 99 labeled subjects (73.7%) fall in the LOW class. A naïve majority-class classifier would therefore achieve 73.7% accuracy by always predicting LOW. Our model's 78.8% represents a modest but real improvement of ~5 percentage points above this baseline, with the key practical benefit being its ability to correctly identify 13 of 26 high performers (50% recall) who would otherwise be missed entirely by a naïve rule. The R² of 0.302 means roughly 70% of inter-subject variance in decoder accuracy remains unexplained, consistent with the inherently noisy, multifactorial nature of BCI performance.
05 Discussion
Across models, the combined low-sample feature representation yielded consistent predictive signal for decoder-derived MI literacy. Random Forest regression outperformed Gradient Boosting, RBF-SVR, and Ridge on average, suggesting the mapping from compact EEG summaries to literacy is moderately non-linear and benefits from interaction modeling.
The binary classifier provides an operational framing of screening: the model achieves strong recall for the majority low-performing class, meaning it can effectively flag individuals who are unlikely to achieve reliable control under the tested MI paradigm. However, sensitivity for high performers is low, so the classifier is best interpreted as a conservative filter rather than a definitive "pass" decision. In practice, this supports a two-stage workflow: use low-sample screening to identify likely low performers early, then reserve longer calibration or alternative paradigms for borderline/high-confidence candidates.
Feature importance patterns are consistent with established MI-BCI mechanisms: CSP class separability and SMR strength dominate, with additional contributions from ERD/ERS and beta power measures (early-trial decodability) and a small set of resting predictors (resting TAR/PSE/RPLα). These results suggest that both baseline rhythm structure and early-trial separability carry complementary information about literacy.
Limitations
- Single dataset: All results derive from the PhysioNet EEG Motor Movement/Imagery Dataset. No external validation on independent cohorts or recording systems was performed.
- Class imbalance: 73 LOW vs. 26 HIGH subjects (73.7% base rate). The classifier's overall accuracy of 78.8% must be interpreted against this skewed prior; HIGH-class recall is only 50%.
- No cross-session or live testing: All analyses are offline and within-session. Real-world deployment would require validation on longitudinal data and live EEG streams.
- Potential information leakage: Feature selection was applied globally rather than strictly within each CV fold, which may mildly inflate reported metrics.
- Mu-only ground truth: The CSP-LDA decoder used only the mu band (8–13 Hz), excluding beta-band contributions that standard pipelines often include.
Potential Improvements, Future Work
A key methodological requirement for final reporting is that scaling and supervised feature selection occur strictly within each cross-validation fold to avoid information leakage and inflated estimates. We also restricted filtering to the mu band (8–13 Hz) as it represents the primary oscillatory correlate of sensorimotor activity during MI. While standard CSP-LDA pipelines commonly include the beta band (8–30 Hz), which may contribute additional discriminative information, we prioritized mu-band activity to minimize spectral noise from non-motor sources. Future work should evaluate whether extending to 8–30 Hz improves ground-truth decoder sensitivity, reporting nested or pipeline-based CV results, and/or validating generalization on additional datasets and populations.
06 Conclusion
We developed a low-sample pre-screening pipeline for MI-BCI literacy that combines a brief resting baseline with only the first n=15 motor imagery trials to compute compact, interpretable EEG-derived features. The best regression model (Random Forest) achieved Pearson's r=0.580 and R²=0.302 against decoder-derived ground truth on subjects with complete labels (N=99). For practical screening, a Random Forest classifier at a 0.65 accuracy threshold achieved LOOCV accuracy 0.788, with high reliability in identifying low performers and moderate sensitivity to high performers. Overall, these results support the feasibility of rapid, data-efficient pre-screening to reduce wasted calibration time, while motivating future work on leakage-free evaluation, improved high-performer detection, and external validation.
07 References
- Goldberger, A. L., et al. (2000). PhysioBank, PhysioToolkit, and PhysioNet: Components of a new research resource for complex physiologic signals. Circulation, 101(23), e215–e220.
- Schalk, G., McFarland, D. J., Hinterberger, T., Birbaumer, N., & Wolpaw, J. R. (2004). BCI2000: A general-purpose brain-computer interface (BCI) system. IEEE Transactions on Biomedical Engineering, 51(6), 1034–1043.
- Blankertz, B., Sannelli, C., Halder, S., Hammer, E. M., Kübler, A., Müller, K. R., et al. (2010). Neurophysiological predictor of SMR-based BCI performance. NeuroImage, 51(4), 1303–1309.
- Gramfort, A., et al. (2013). MEG and EEG data analysis with MNE-Python. Frontiers in Neuroscience, 7, 267.
- Wang, Y., Wang, R., Gao, X., Hong, B., & Gao, S. (2006). A practical VEP-based brain-computer interface. IEEE Transactions on Neural Systems and Rehabilitation Engineering, 14(2), 234–240.
- Ahn, M., & Jun, S. C. (2015). Performance variation in motor imagery brain-computer interface: A brief review. Journal of Neuroscience Methods, 243, 103–110.
- Schmidt, R., Herrojo Ruiz, M., Kilavik, B. E., Lundqvist, M., Starr, P. A., & Aron, A. R. (2019). Beta oscillations in working memory, executive control of movement and thought, and sensorimotor function. Journal of Neuroscience, 39(42), 8231–8238.
- Inouye, T., Shinosaki, K., Sakamoto, H., Toi, S., Ukai, S., Iyama, A., et al. (1991). Quantification of EEG irregularity by use of the entropy of the power spectrum. Electroencephalography and Clinical Neurophysiology, 79(3), 204–210.
- Lempel, A., & Ziv, J. (1976). On the complexity of finite sequences. IEEE Transactions on Information Theory, 22(1), 75–81.
- Kubota, Y., Sato, W., Murai, T., Toichi, M., Ikeda, A., & Sengoku, A. (2001). Frontal midline theta rhythm is correlated with cardiac autonomic activities during the performance of an attention demanding meditation procedure. Brain Research Cognitive Brain Research, 11(2), 281–287.
- Klimesch, W. (1999). EEG alpha and theta oscillations reflect cognitive and memory performance: A review and analysis. Brain Research Reviews, 29(2–3), 169–195.
- Mei, J., et al. (2024). MetaBCI: A new open-source Python package for brain-computer interfaces. arXiv preprint.
- Borgheai, S. B., et al. (2024). Predicting BCI performance from resting-state EEG features. Neurocomputing, 107658.
- Pfurtscheller, G., & Lopes da Silva, F. H. (1999). Event-related EEG/MEG synchronization and desynchronization: Basic principles. Clinical Neurophysiology, 110(11), 1842–1857.
- Neuper, C., Wörtz, M., & Pfurtscheller, G. (2006). ERD/ERS patterns reflecting sensorimotor activation and deactivation. Progress in Brain Research, 159, 211–222.
A Appendix
Supplementary Graphics